startree
startree
startree
startree
helping teams react faster with instant database change alerts.
year
2022
year
2022
year
2022
year
2022
duration
6 weeks
duration
6 weeks
duration
6 weeks
duration
6 weeks
category
UI/UX
category
UI/UX
category
UI/UX
category
UI/UX
industry
Data & Analytics, Enterprise SaaS, Dev Tools
industry
Data & Analytics, Enterprise SaaS, Dev Tools
industry
Data & Analytics, Enterprise SaaS, Dev Tools
industry
Data & Analytics, Enterprise SaaS, Dev Tools
00
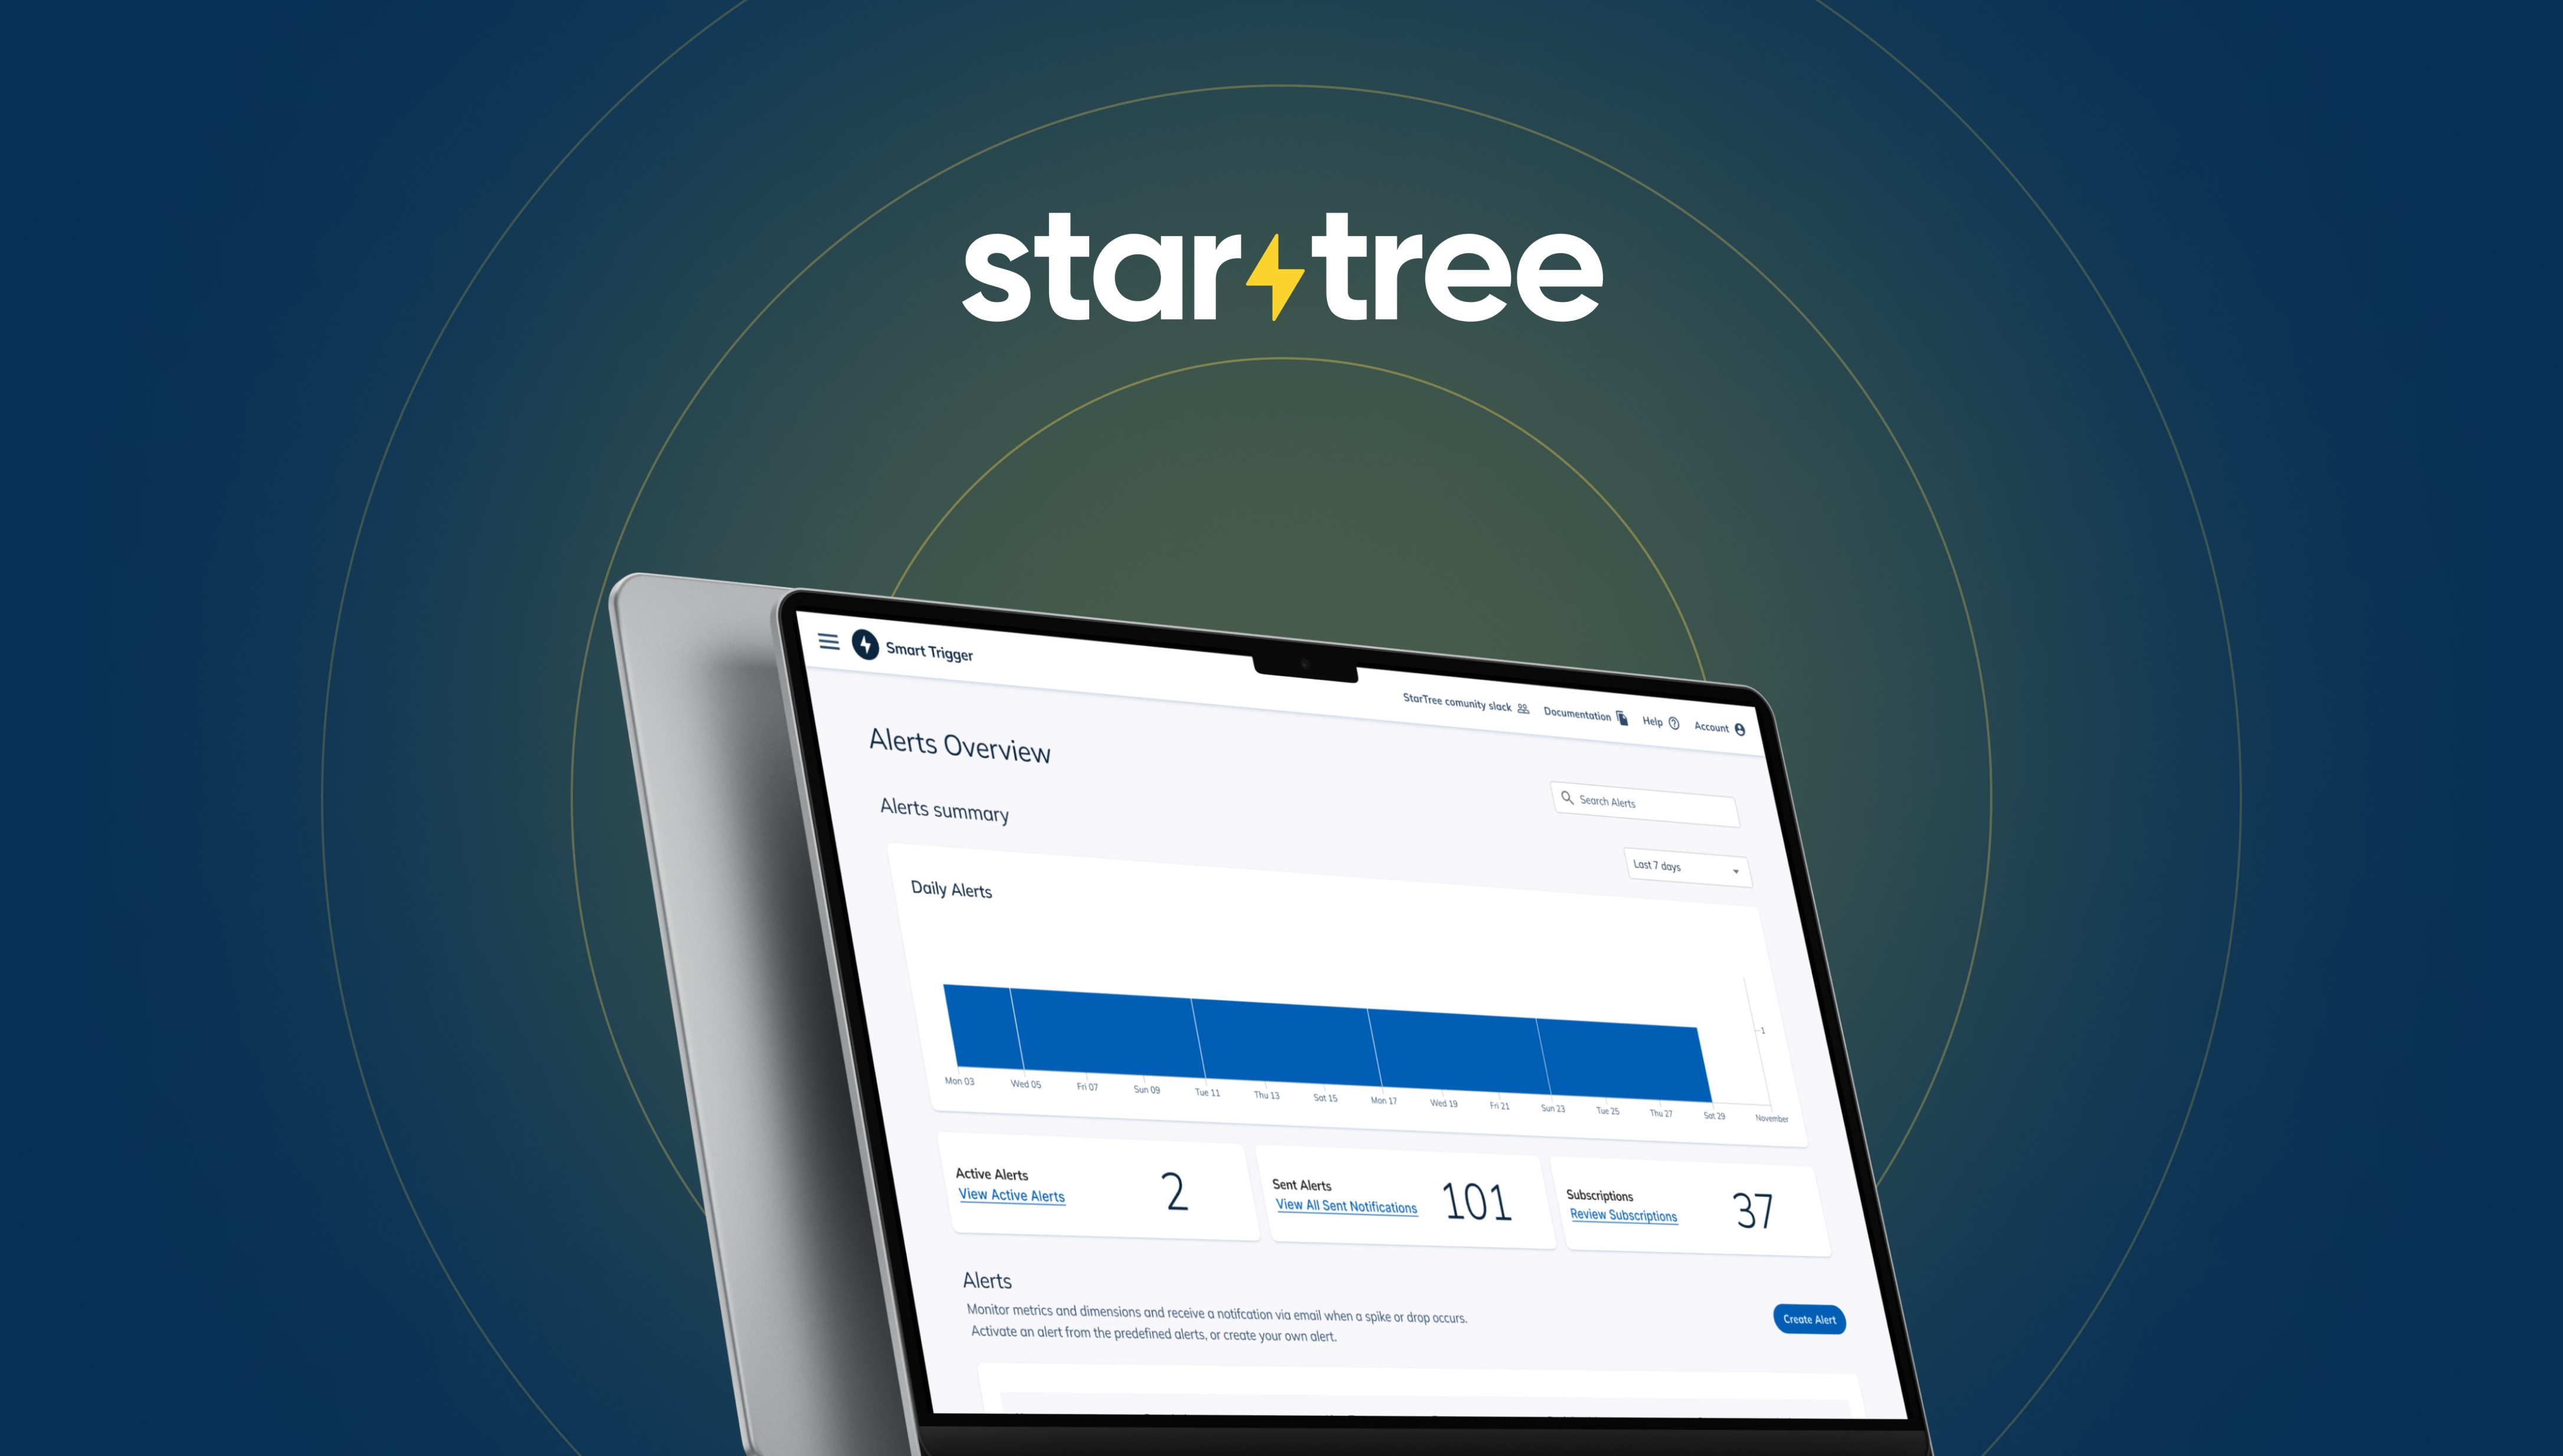
StarTree, founded by the creators of Apache Pinot, provides a fully managed cloud service that powers real-time data applications for companies like LinkedIn, Uber Eats, Stripe, and Guitar Center. Their platform enables businesses to harness scalable, high-concurrency analytics, delivering actionable insights instantly.
As the UX Designer for the Smart Trigger project, I drove the end-to-end user experience—from research and ideation to final design and implementation. I worked closely with developers to ensure a seamless integration of design and functionality, balancing technical feasibility with an intuitive user experience.
01

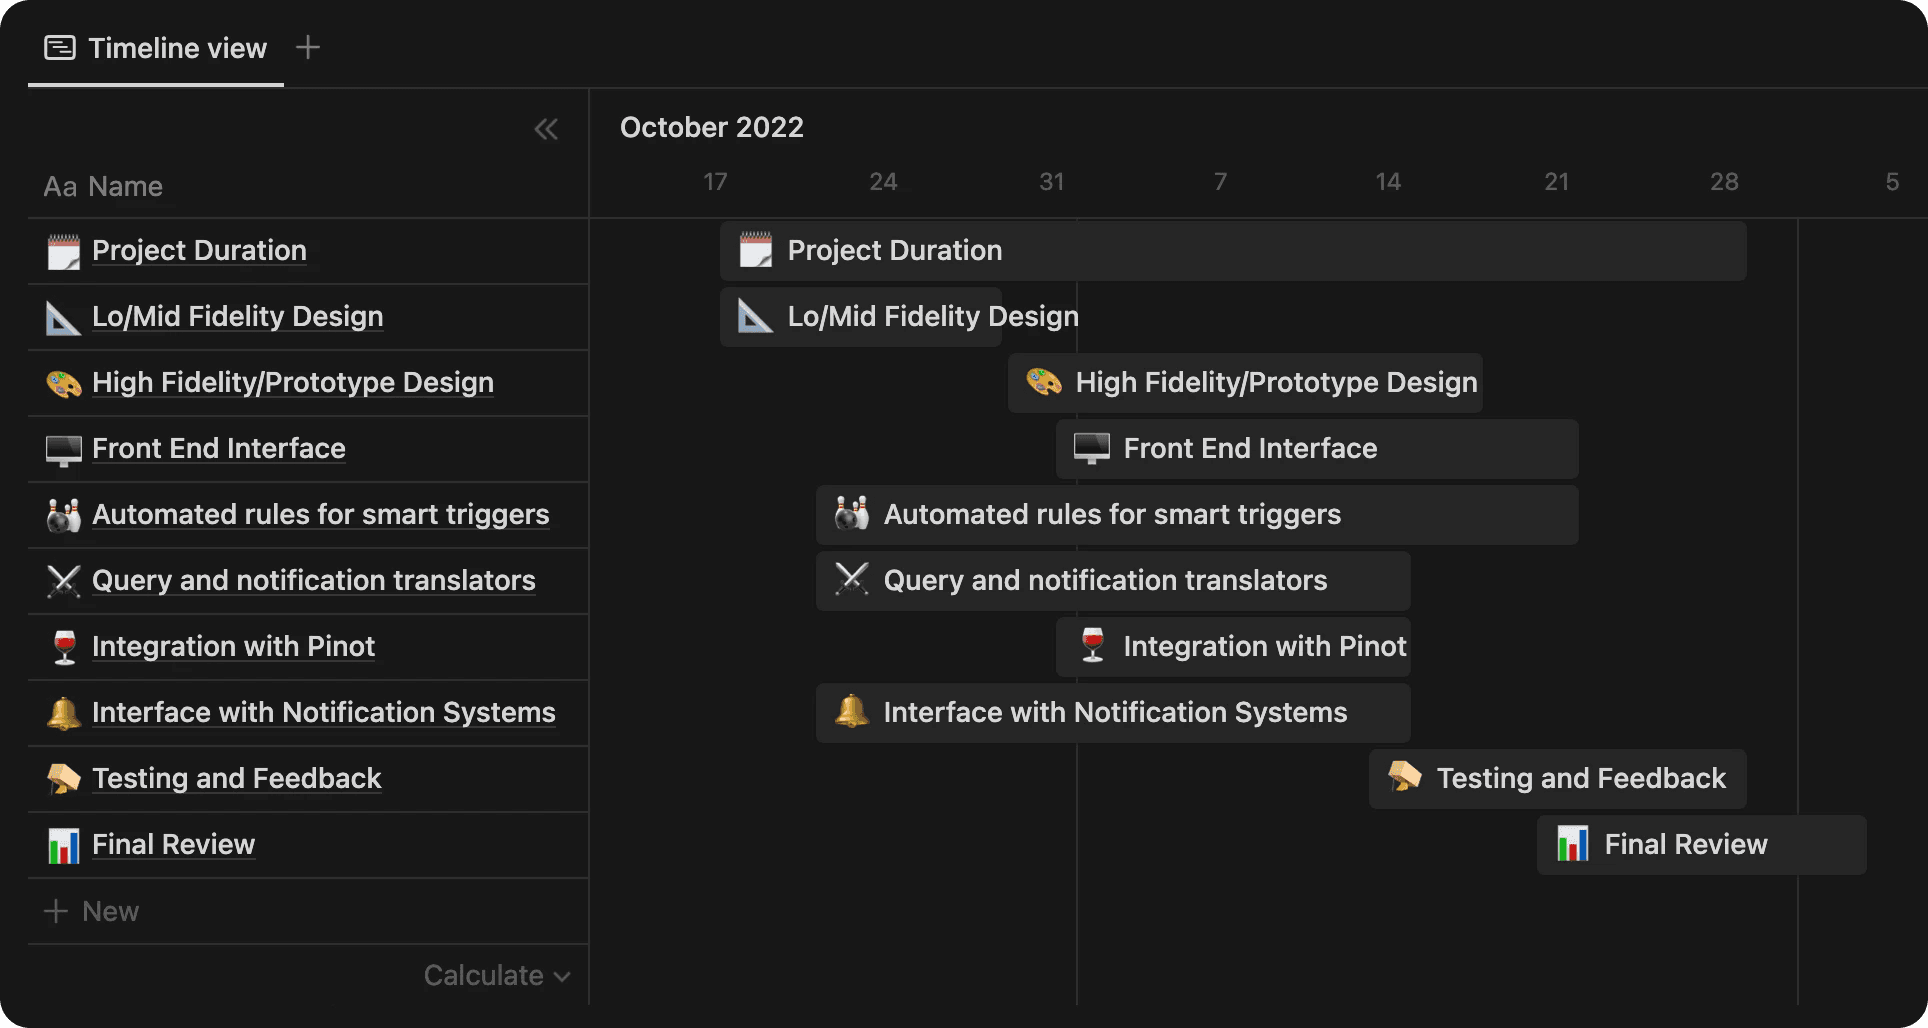
Project Timeline
I was given a tight deadline of 6 weeks from October to November 2022 to complete the project. To ensure that we could meet the deadline, my team adopted an agile workflow and worked in weekly sprints to achieve our goals.
The Problem Statement 🧠
How might we create a user-friendly interface for non-technical users that allows them to easily monitor vast amounts of data in real-time and generate alerts based on pre-defined rules, while also providing low-latency alerts?
Research
Literature Review
The first step in the design process was for me to conduct a literature review. This involved familiarizing myself with the terminology and concepts related to real-time analytics, as well as the mission of StarTree. I wanted to ensure that I had a deep understanding of the project at hand so that I could create a user experience that was aligned with the company's goals.
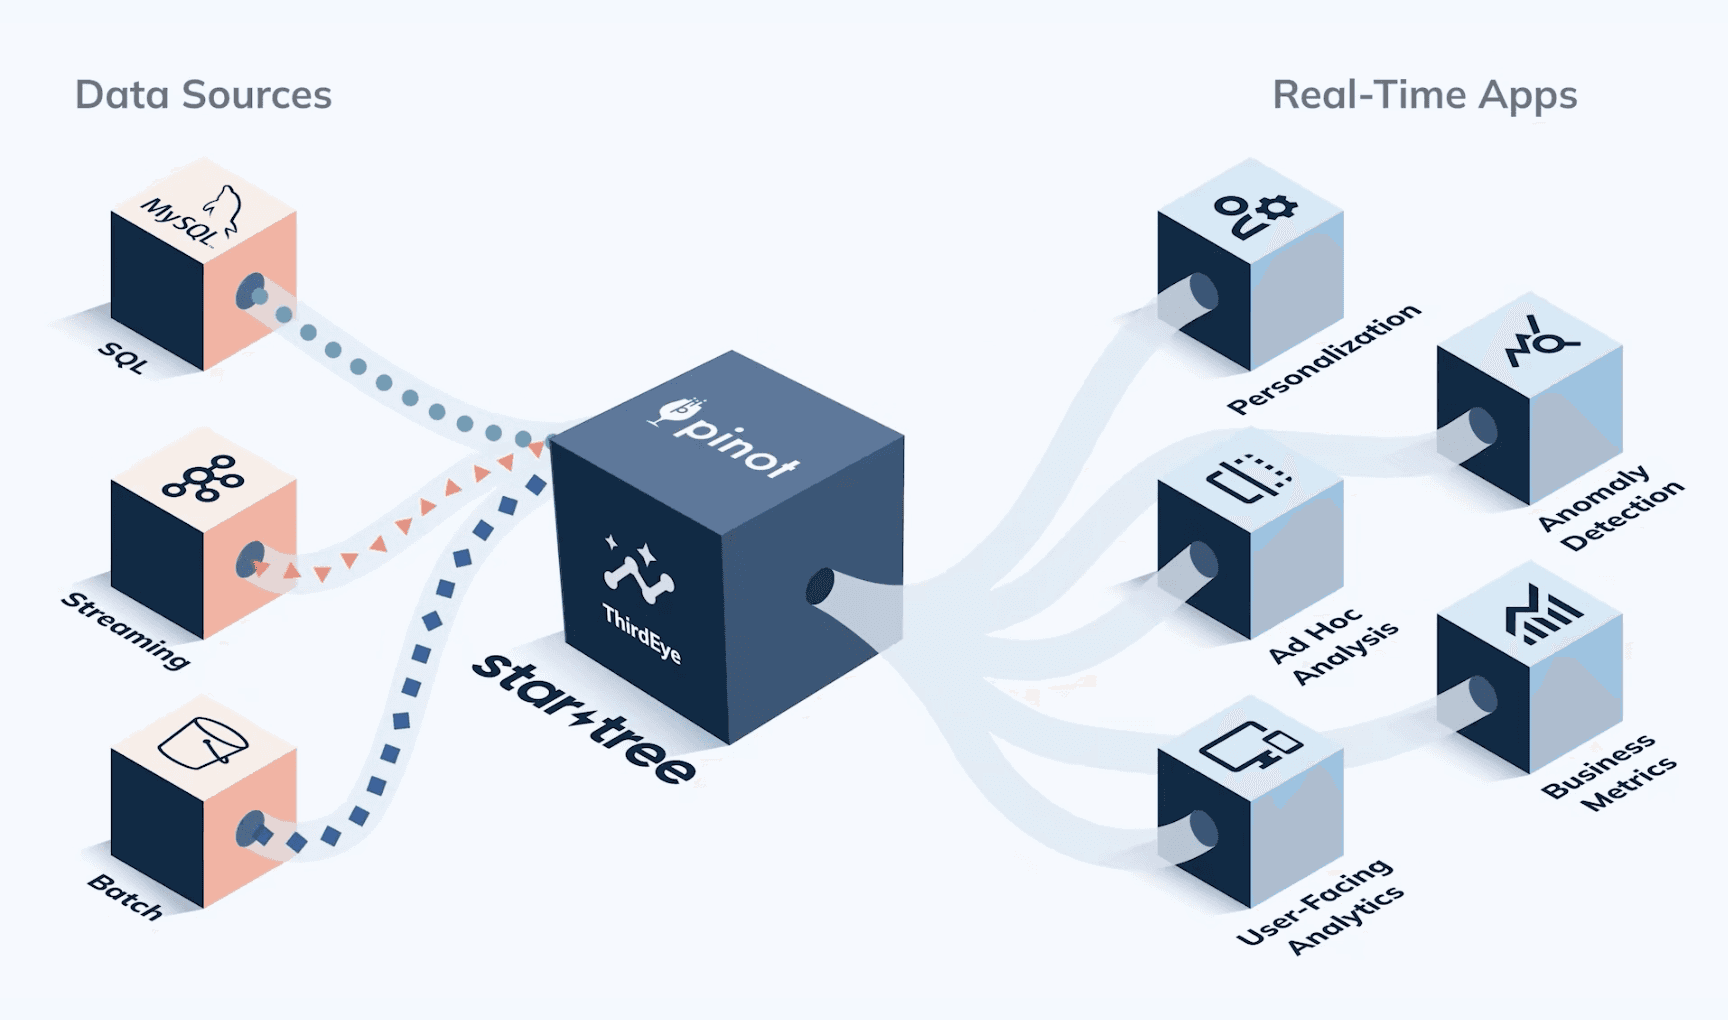
Real-time analytics is the discipline that applies logic and mathematics to data to provide insights for making better decisions quickly. For some use cases, real time simply means the analytics is completed within a few seconds or minutes after the arrival of new data.
On-demand real-time analytics: waits for users or systems to request a query and then delivers the analytic results.
Continuous real-time analytics: is more proactive and alerts users or triggers responses as events happen.
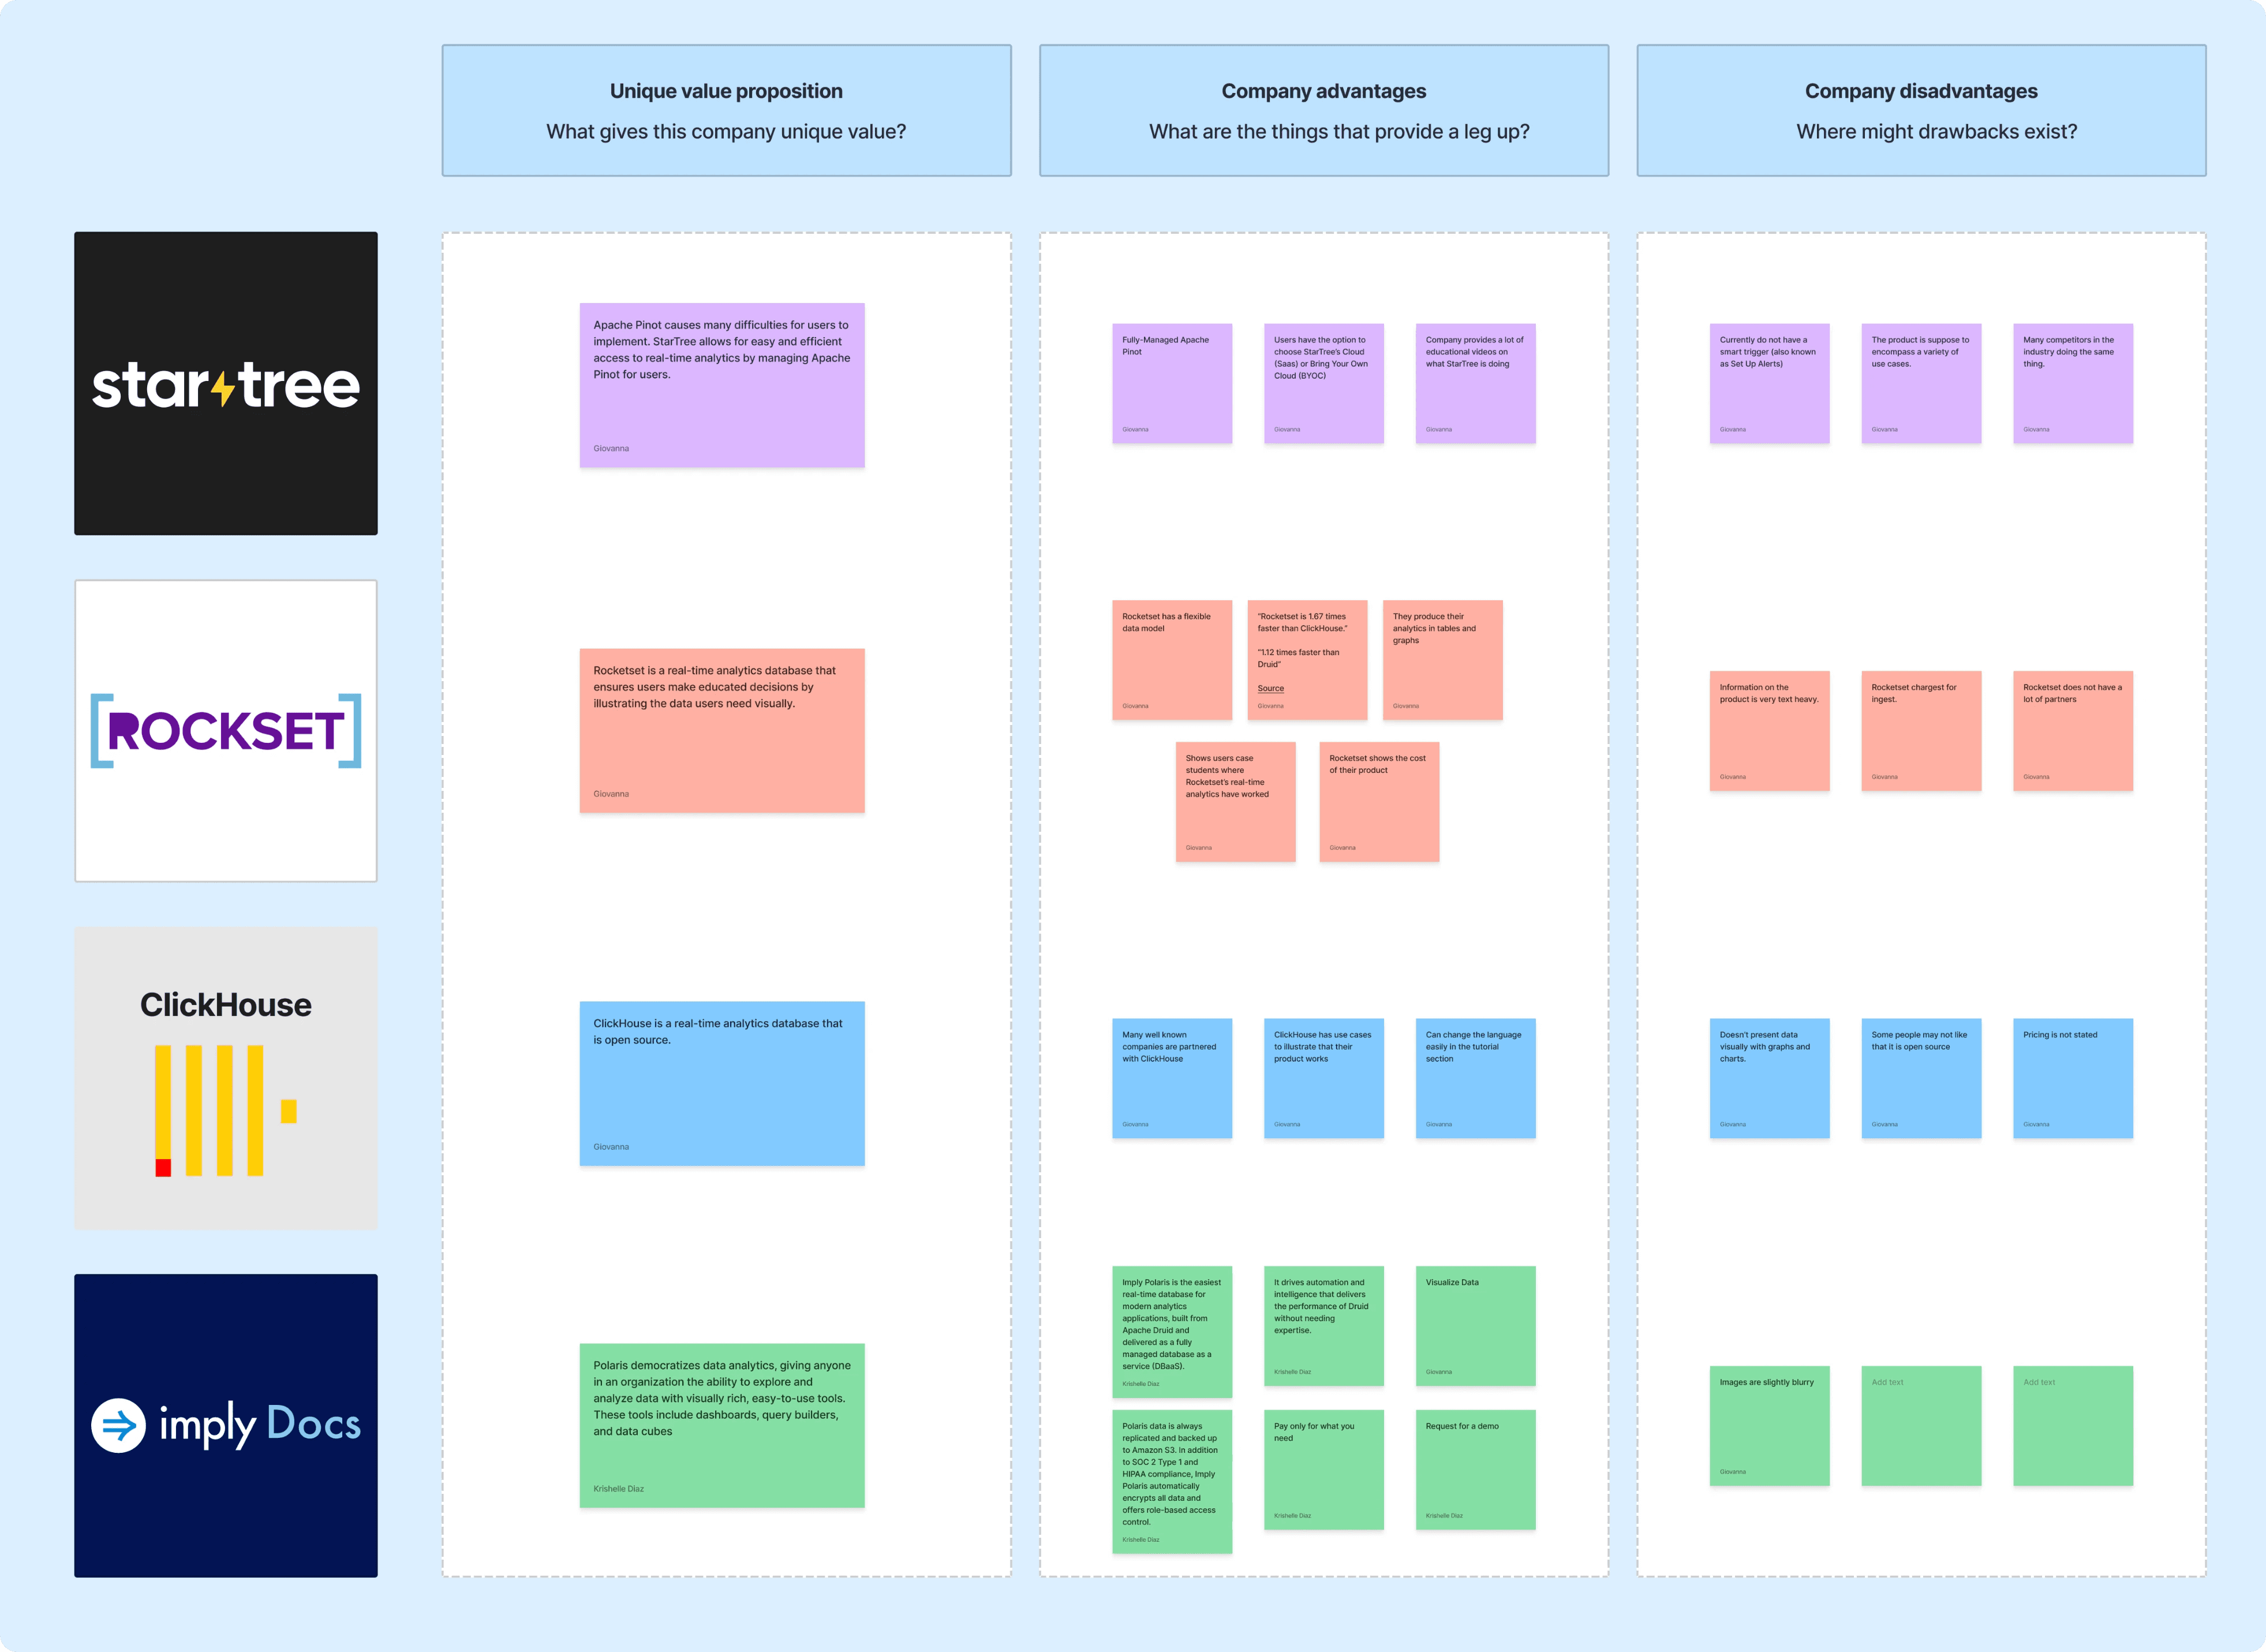
Competitive Analysis
I conducted a thorough competitive analysis to understand how other companies executed alert triggers in their software. I then took note of similarities, learnings, and opportunities.
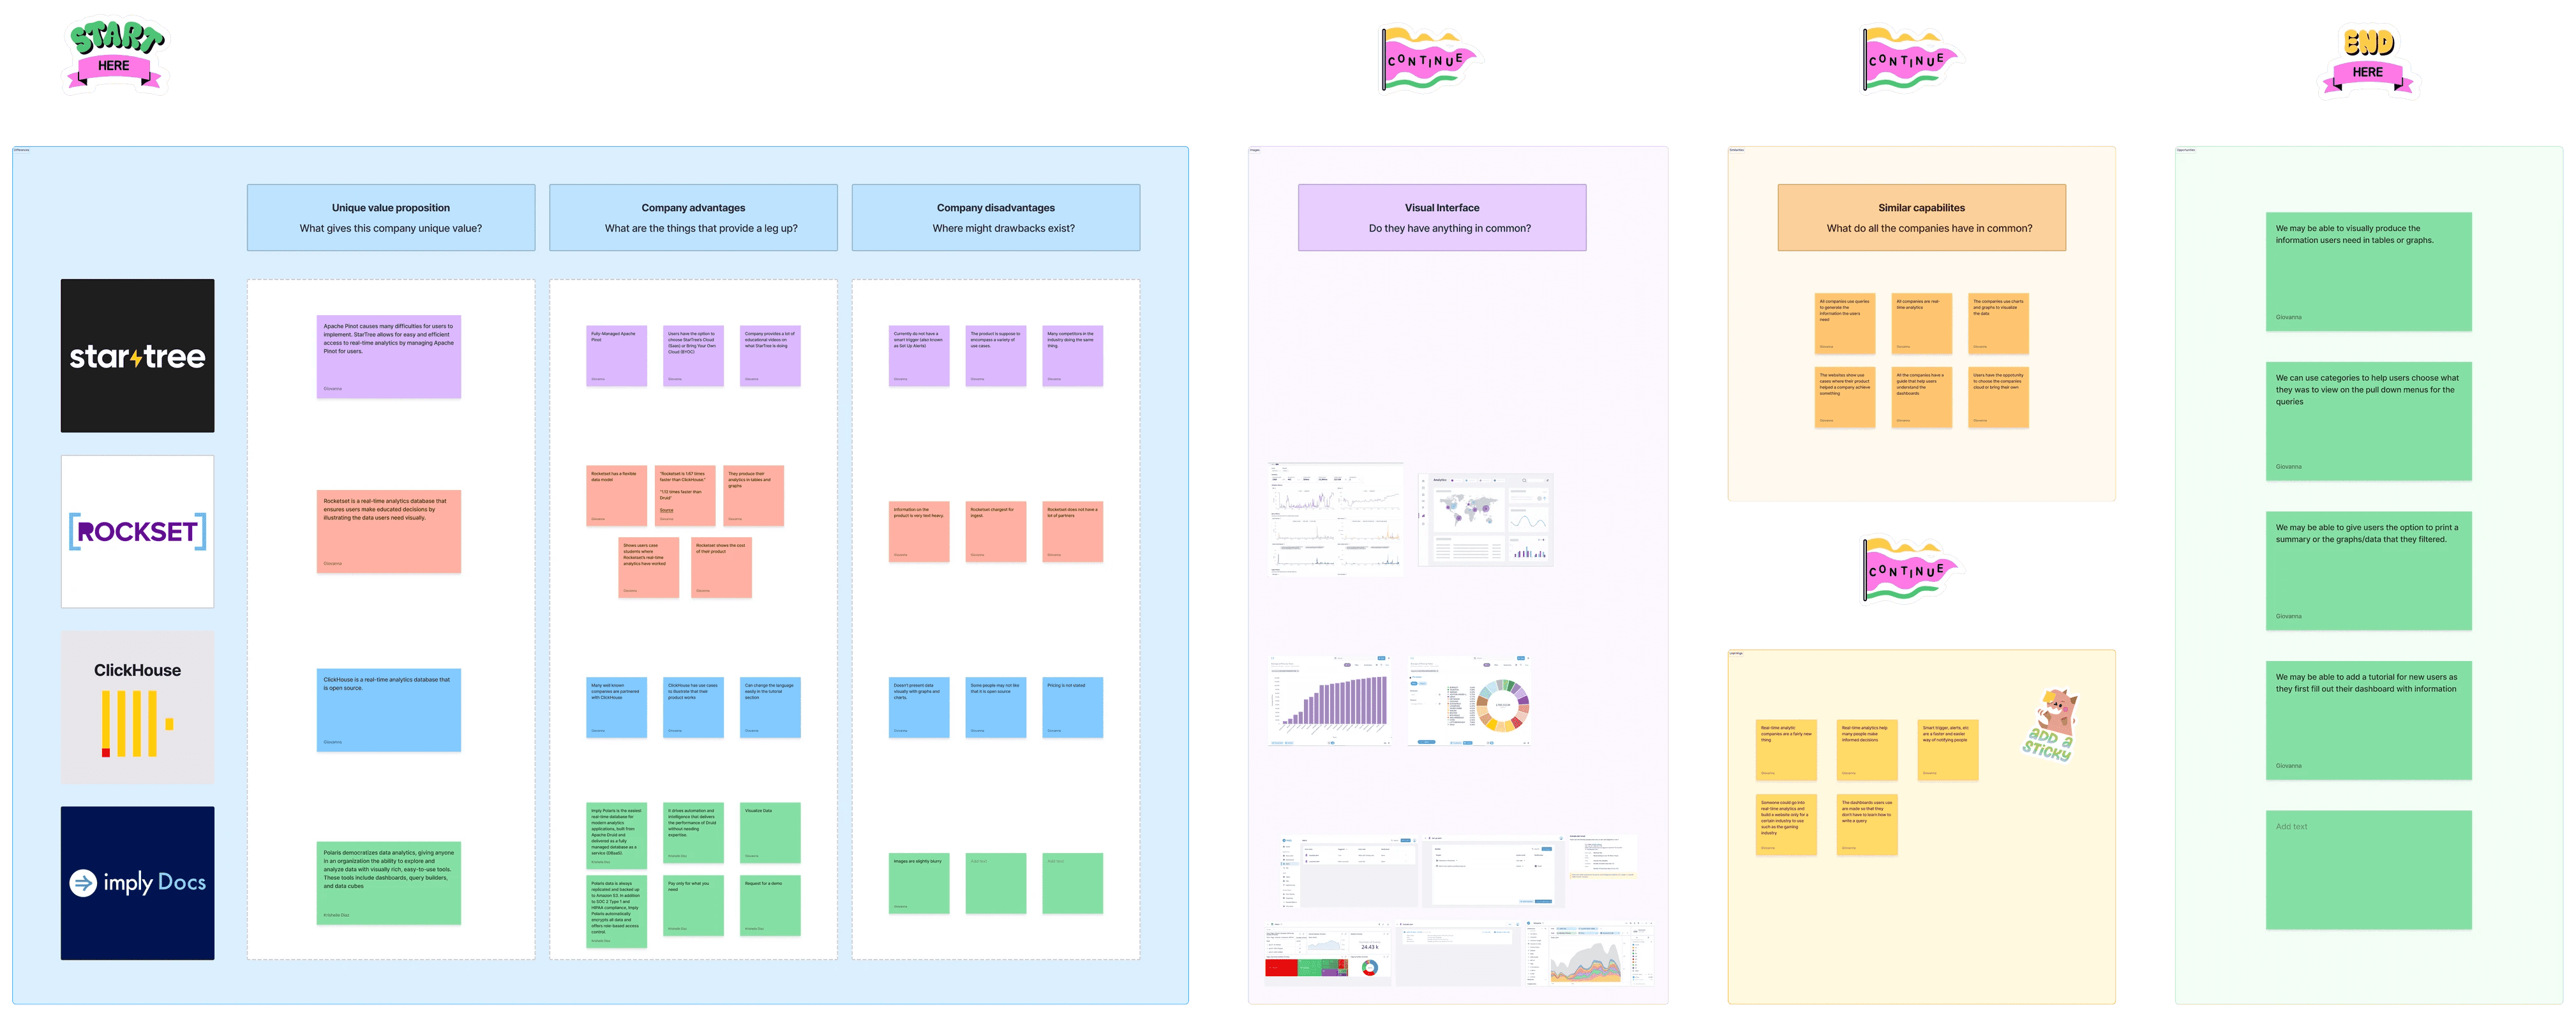
I then synthesized the findings into HMW (How Might We) statements to prioritize main themes for our design and development process, with a focus on using non-jargon terms and clear CTA (Call-to-Action) buttons.
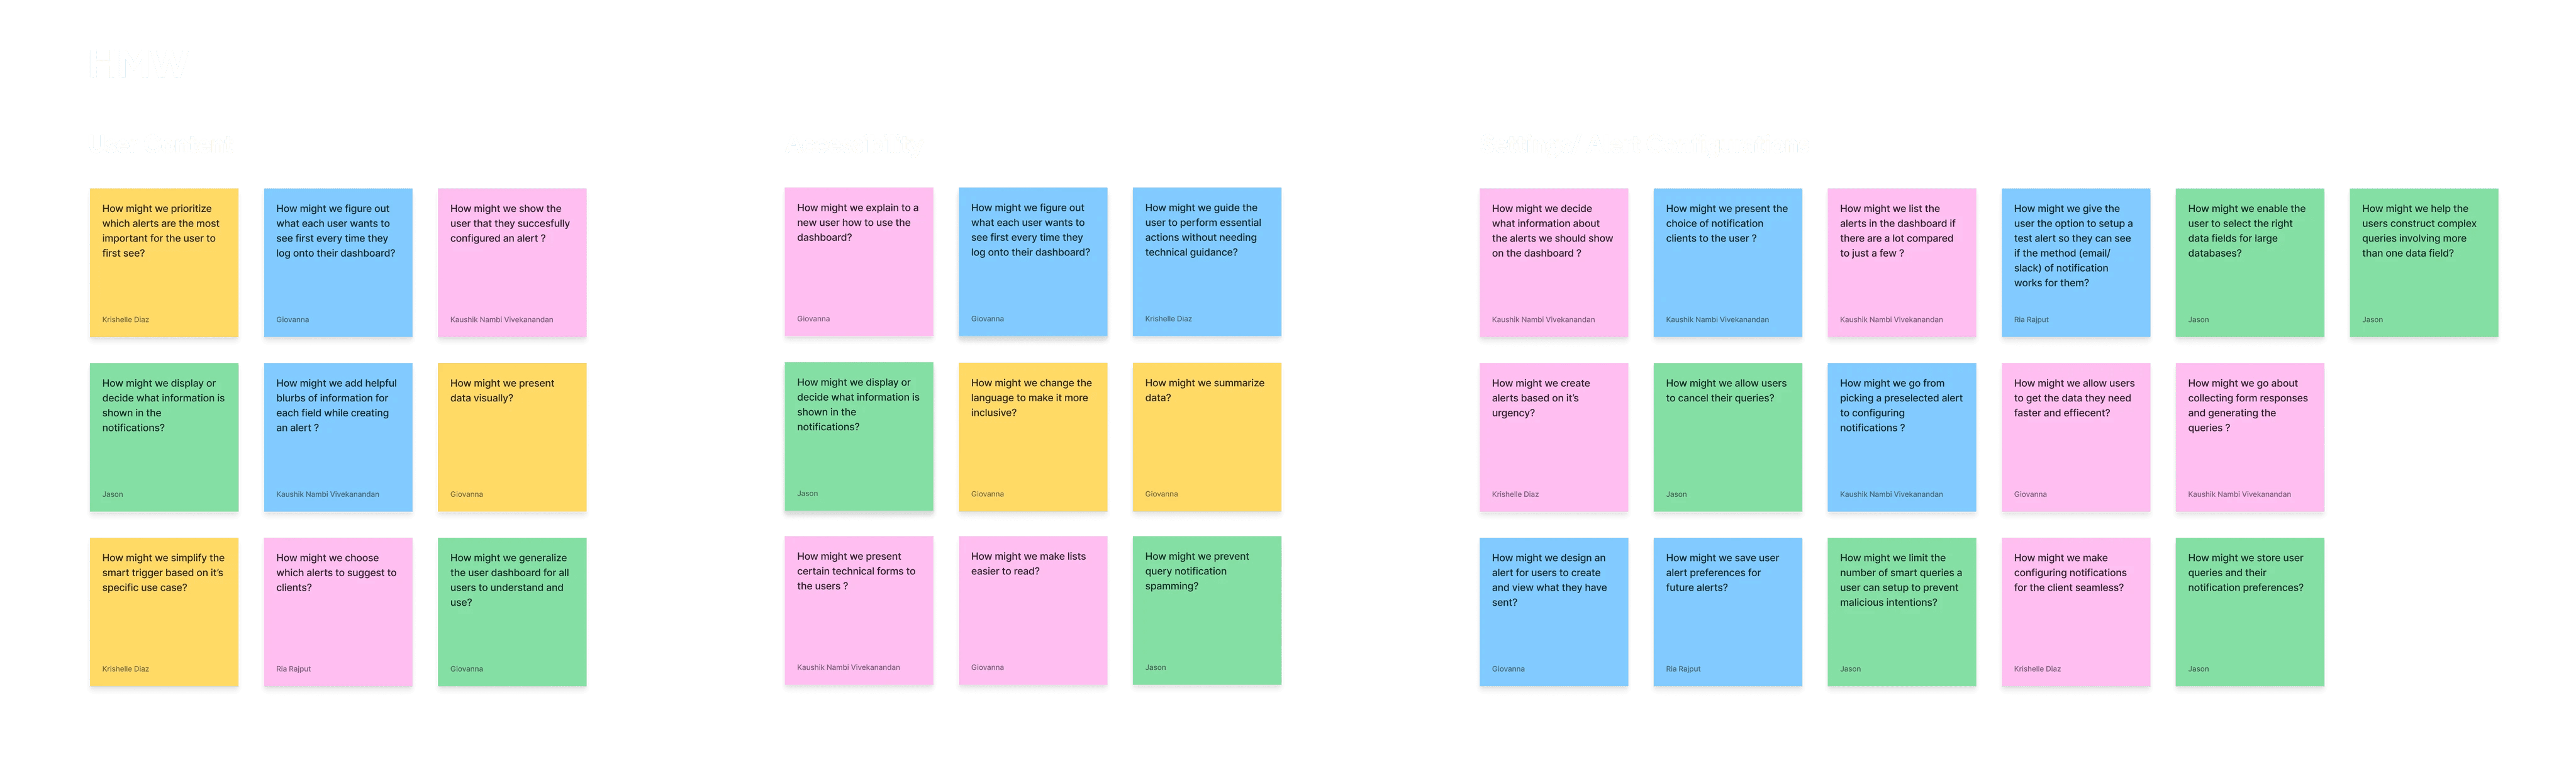
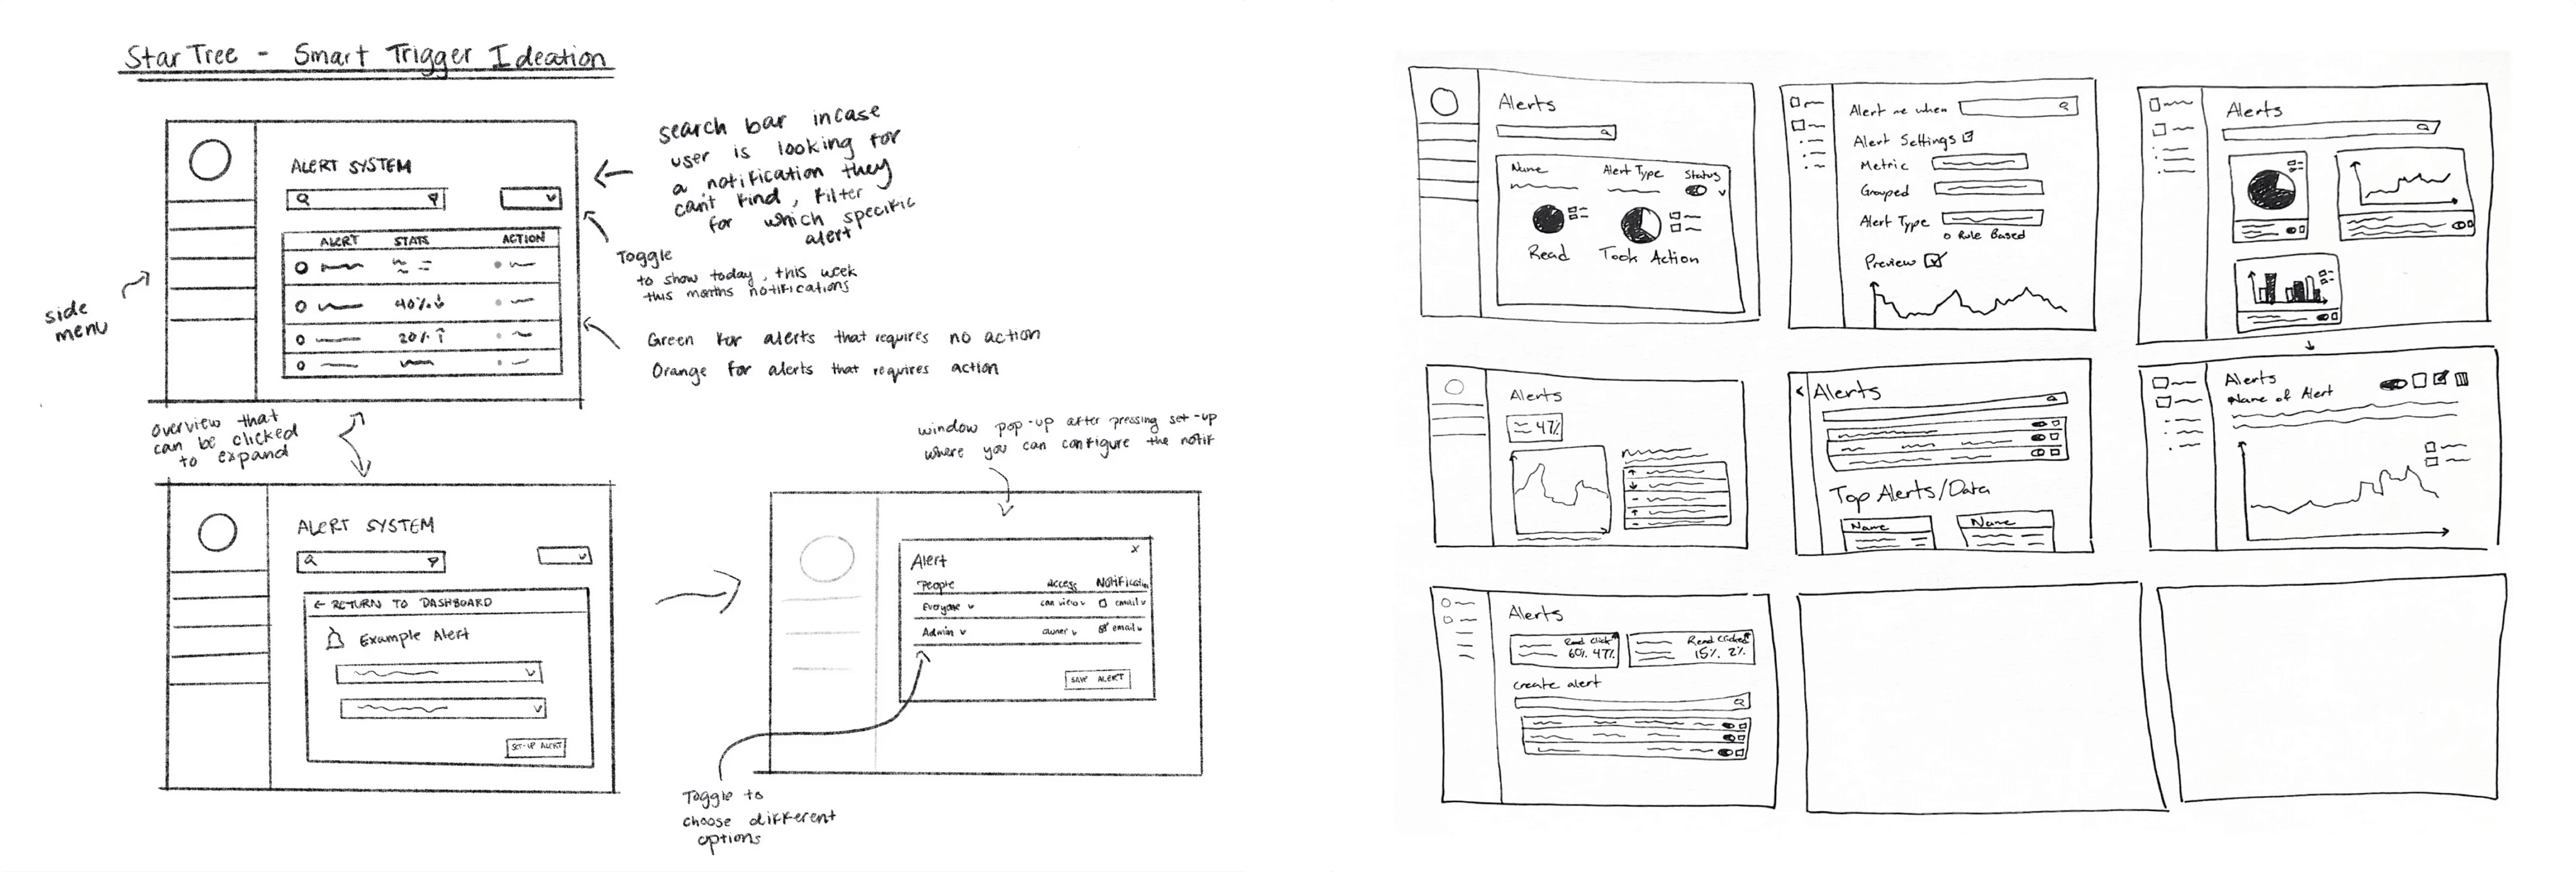
Ideation
After discussing my findings with our Project Manager, I sketched our design ideas and proposed a few user flows.
The Design
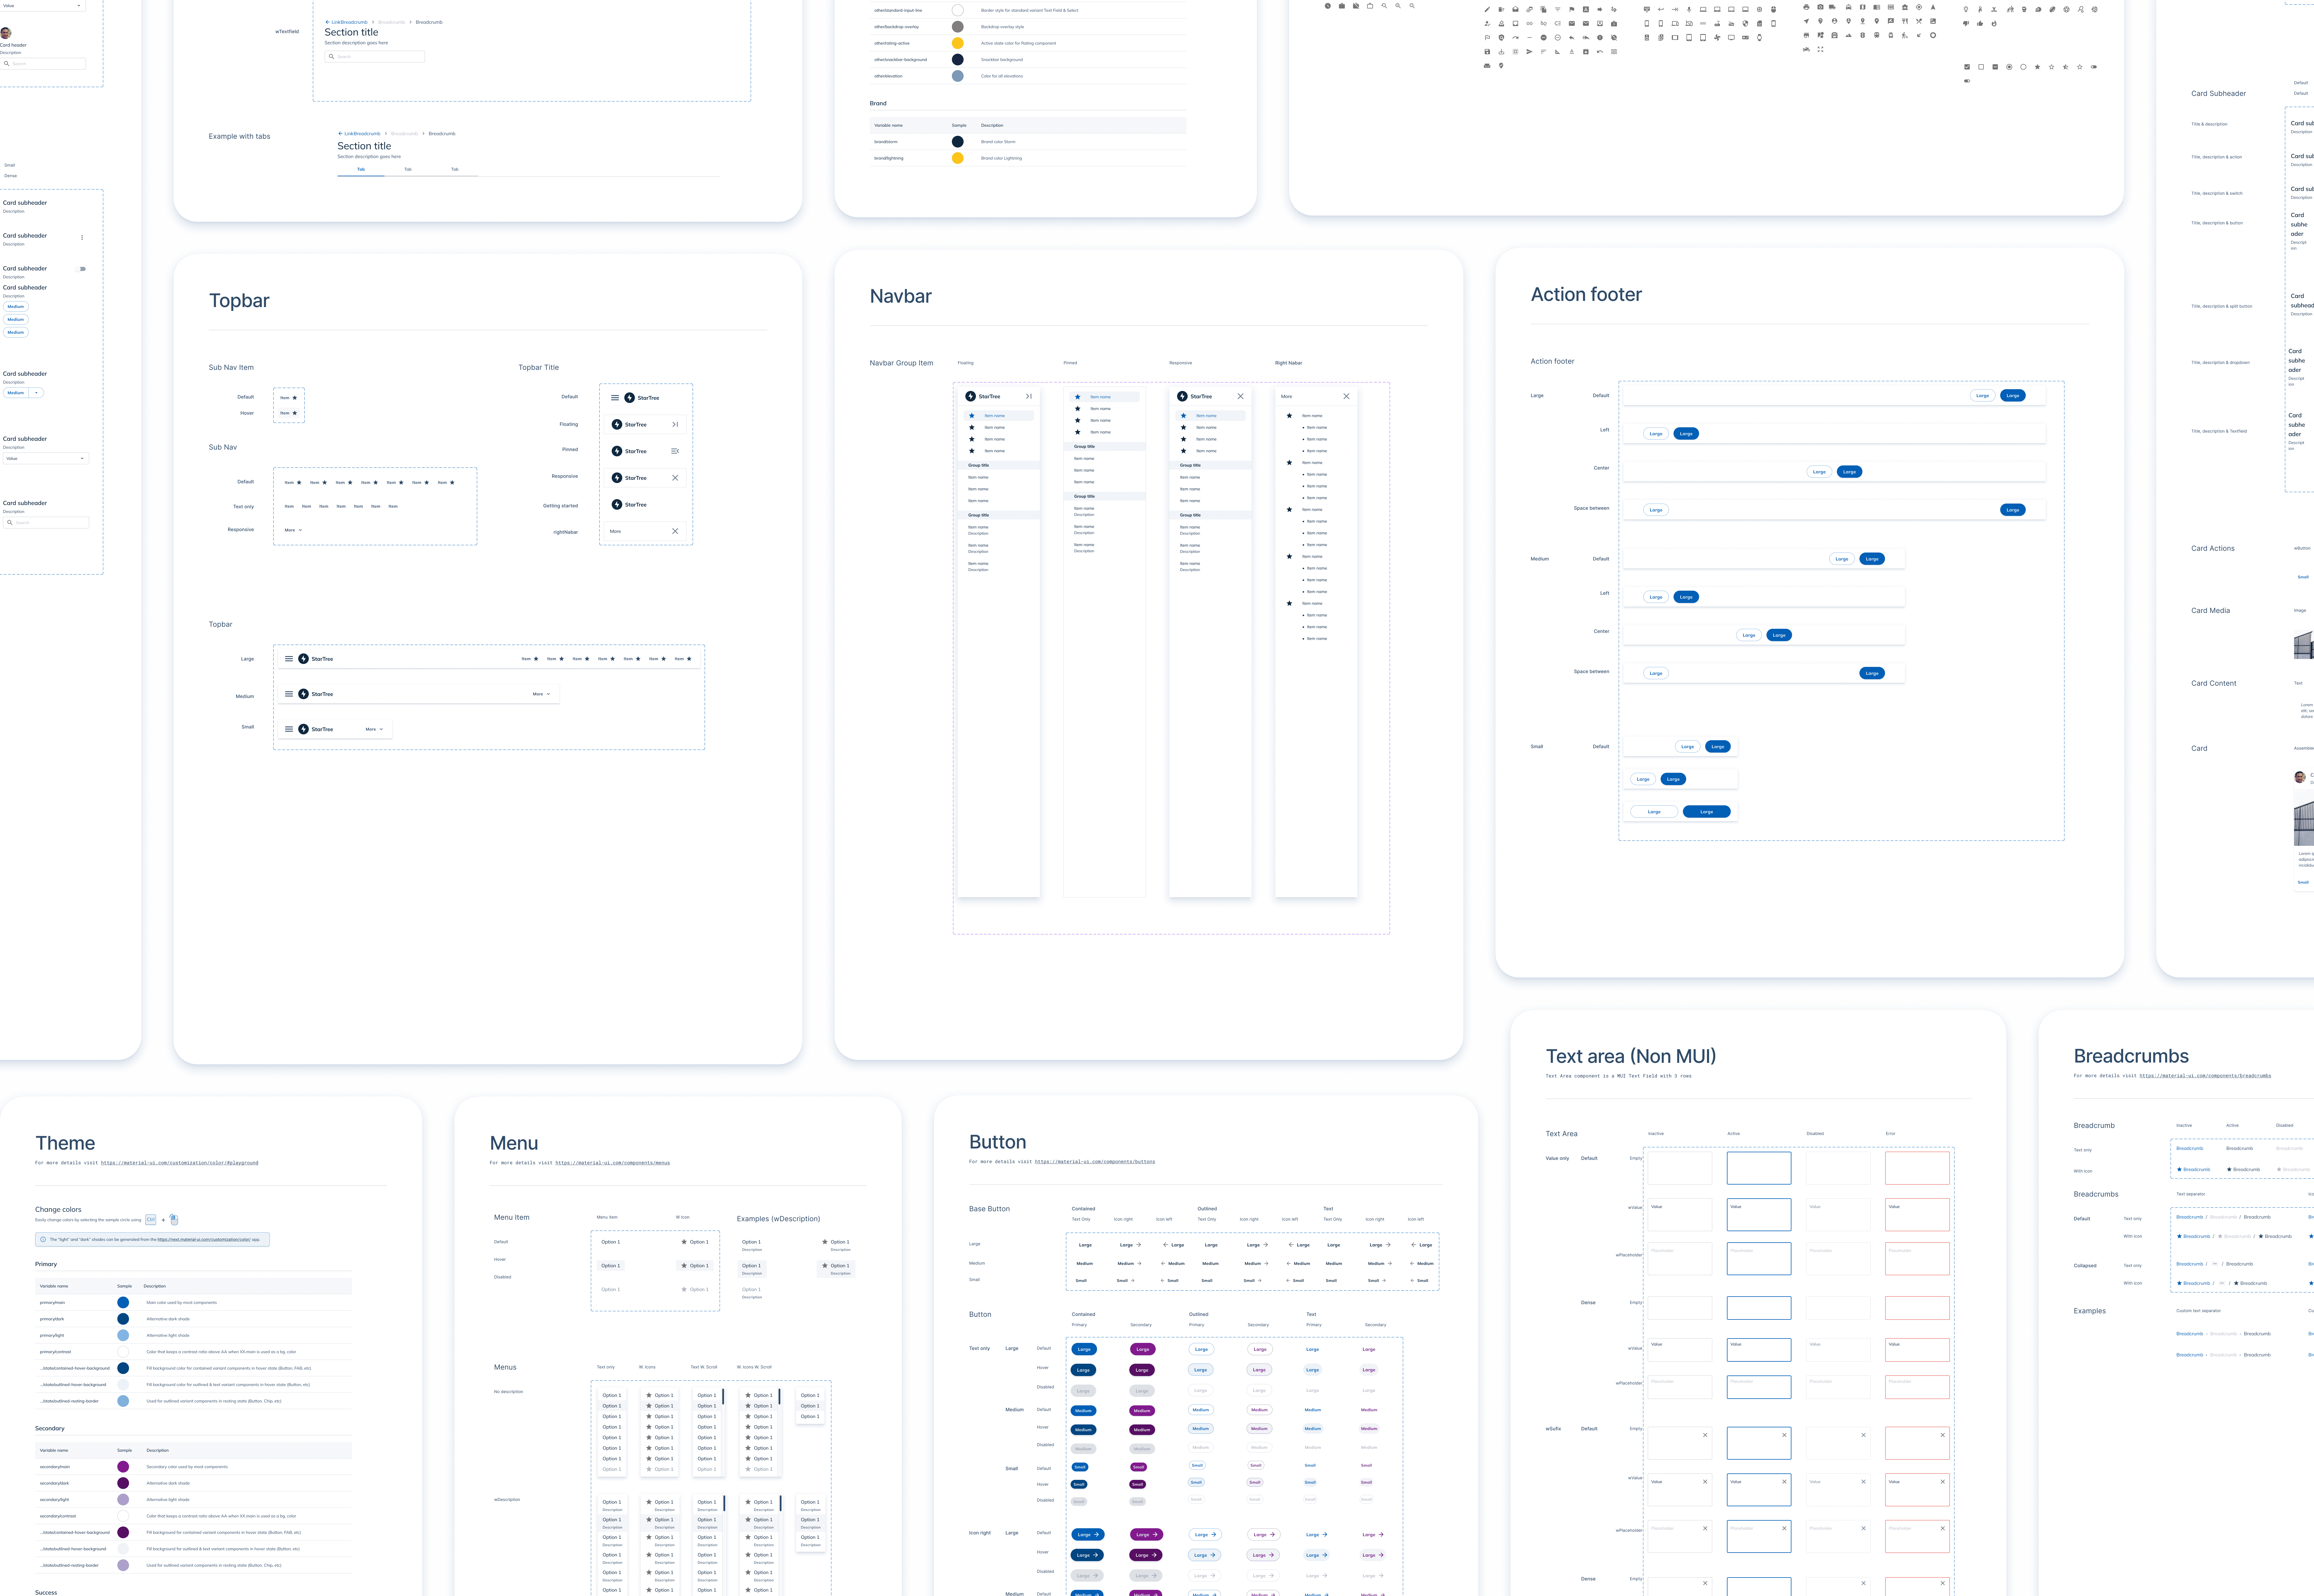
Components
We used StarTree's design system to maintain consistency and uphold branding throughout the project. Additionally, I created new components to align with the Smart Trigger Project's requirements.
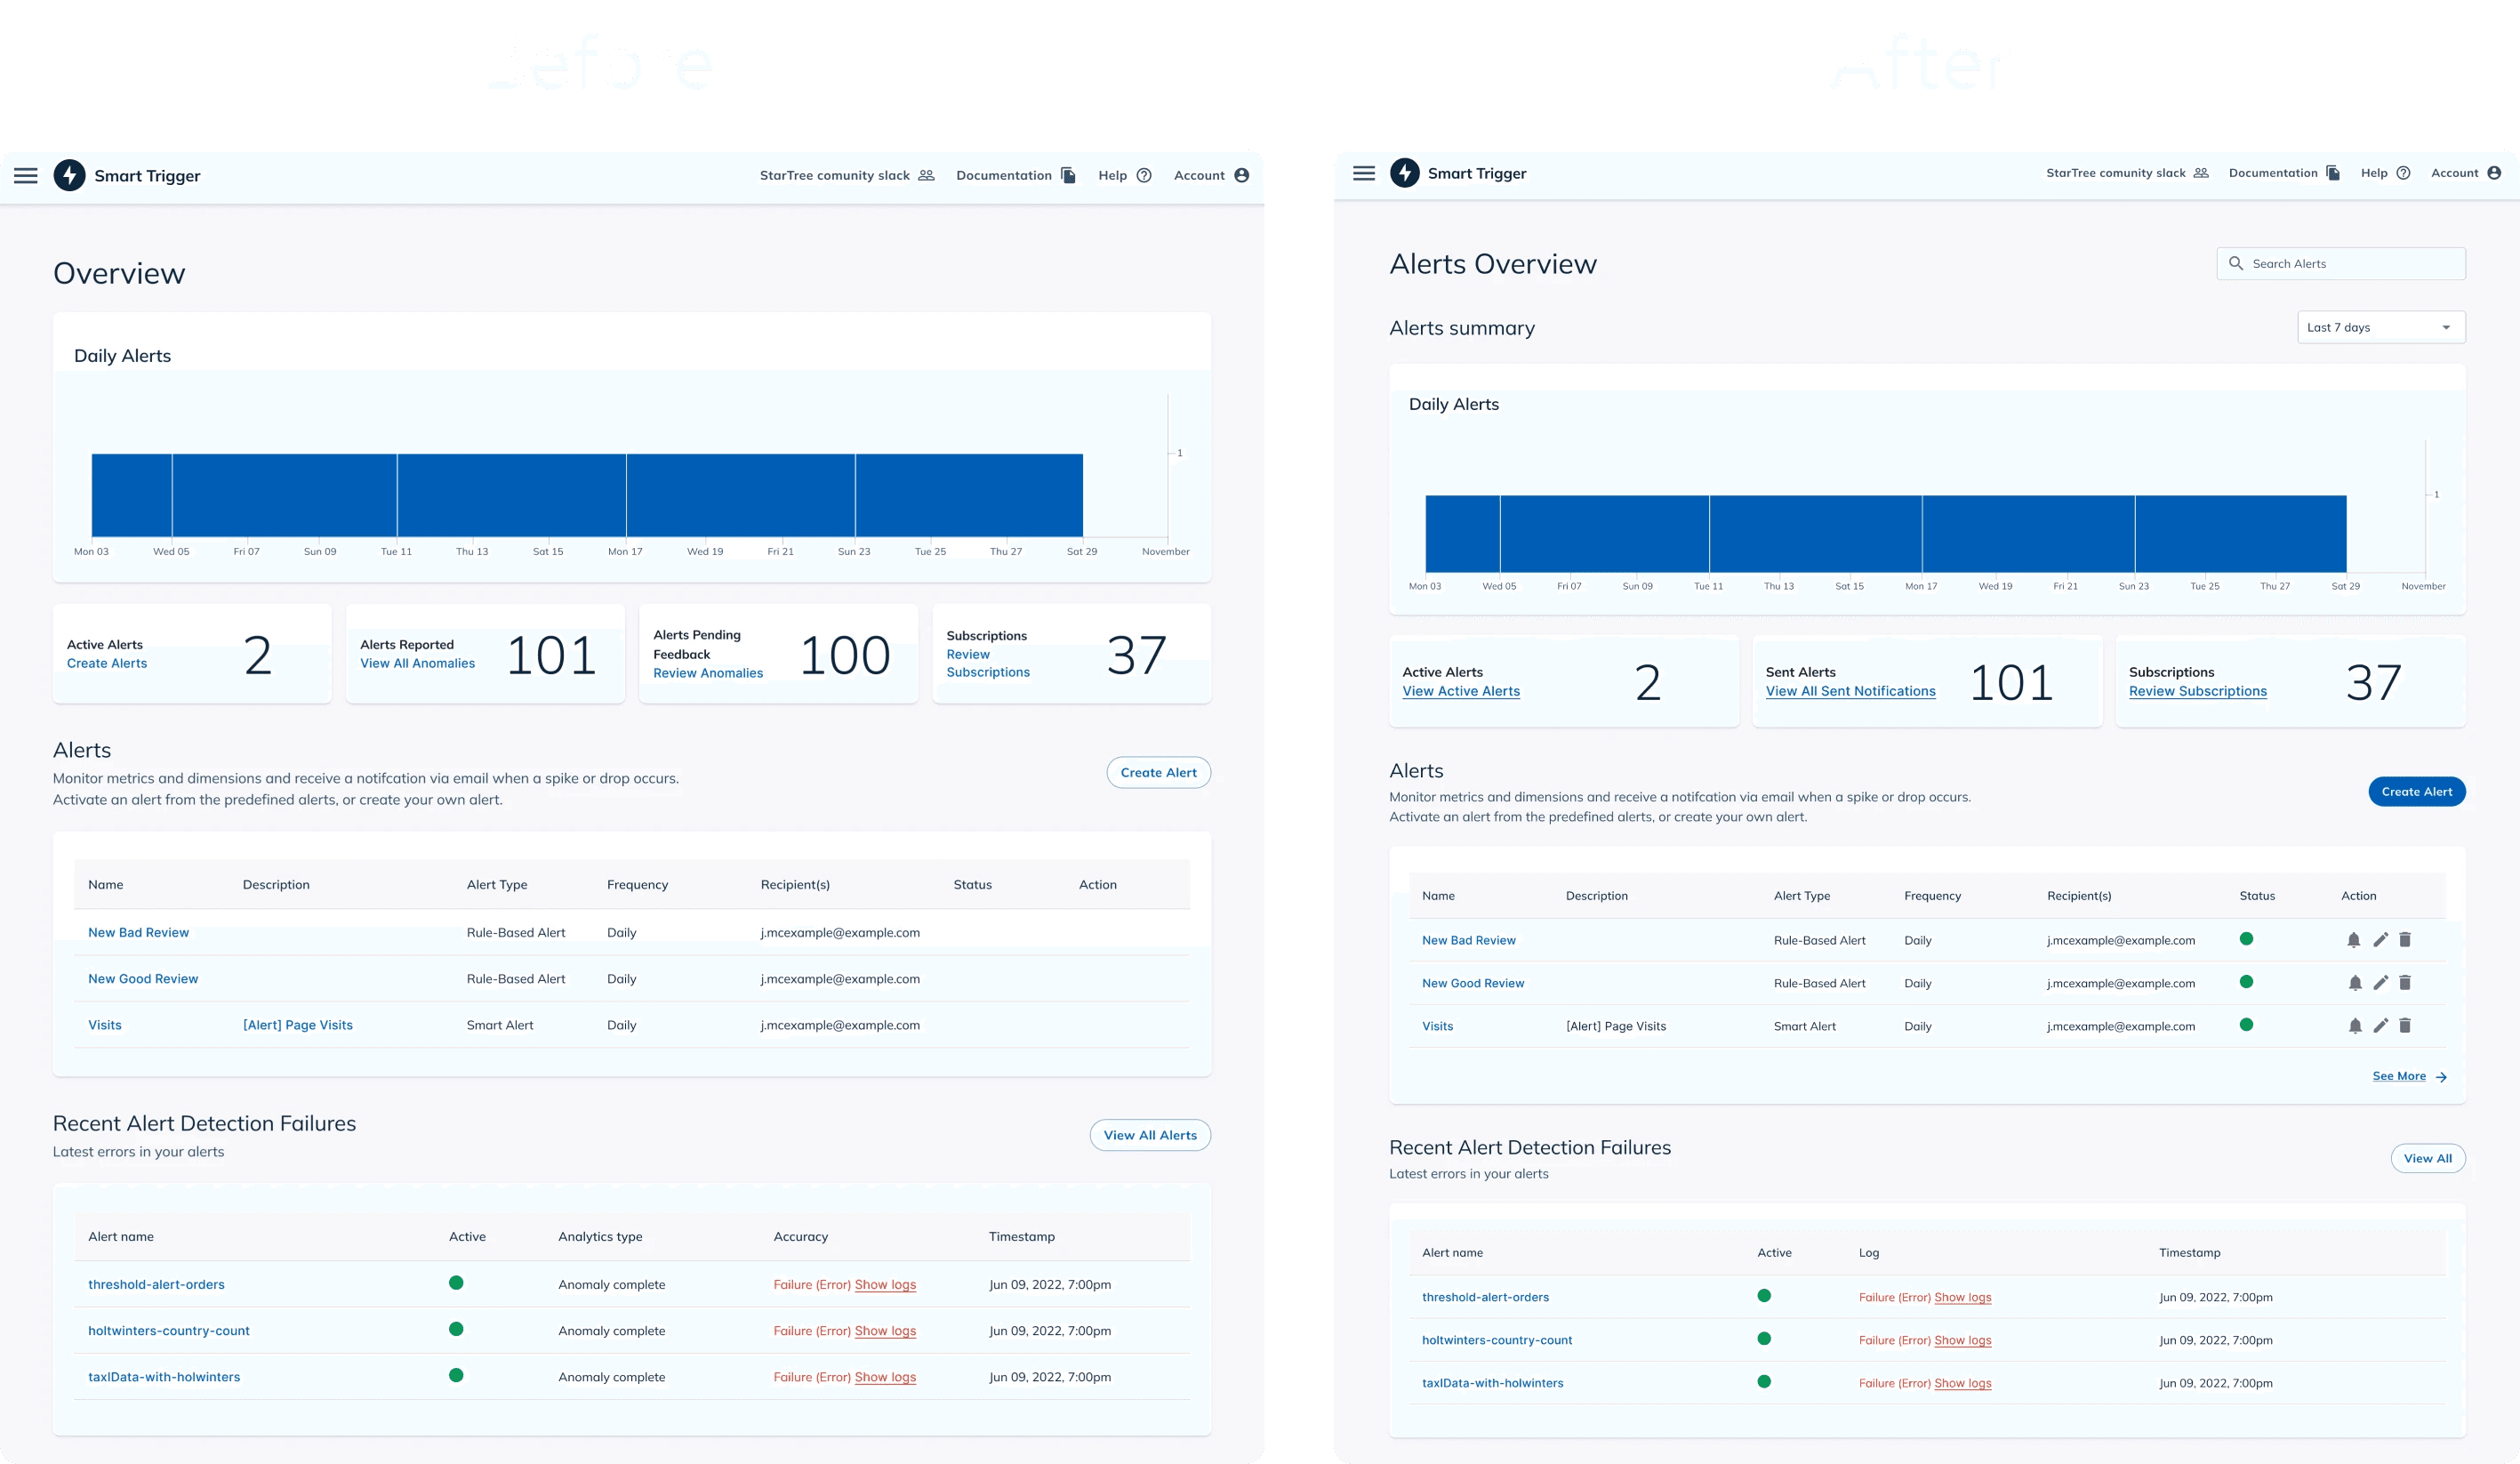
Refining the Design
The dashboard design underwent several iterations through A/B testing while adhering to a hierarchical design system. I developed various designs, tested them for user engagement, click-through rates, and time spent on the page, and made final adjustments based on these results. Enhancements included adding a search bar, data filters, and layout changes to improve user-friendliness and effectiveness.
Project Timeline
I was given a tight deadline of 6 weeks from October to November 2022 to complete the project. To ensure that we could meet the deadline, my team adopted an agile workflow and worked in weekly sprints to achieve our goals.
The Problem Statement 🧠
How might we create a user-friendly interface for non-technical users that allows them to easily monitor vast amounts of data in real-time and generate alerts based on pre-defined rules, while also providing low-latency alerts?
Research
Literature Review
The first step in the design process was for me to conduct a literature review. This involved familiarizing myself with the terminology and concepts related to real-time analytics, as well as the mission of StarTree. I wanted to ensure that I had a deep understanding of the project at hand so that I could create a user experience that was aligned with the company's goals.
Real-time analytics is the discipline that applies logic and mathematics to data to provide insights for making better decisions quickly. For some use cases, real time simply means the analytics is completed within a few seconds or minutes after the arrival of new data.
On-demand real-time analytics: waits for users or systems to request a query and then delivers the analytic results.
Continuous real-time analytics: is more proactive and alerts users or triggers responses as events happen.
Competitive Analysis
I conducted a thorough competitive analysis to understand how other companies executed alert triggers in their software. I then took note of similarities, learnings, and opportunities.
I then synthesized the findings into HMW (How Might We) statements to prioritize main themes for our design and development process, with a focus on using non-jargon terms and clear CTA (Call-to-Action) buttons.
Ideation
After discussing my findings with our Project Manager, I sketched our design ideas and proposed a few user flows.
The Design
Components
We used StarTree's design system to maintain consistency and uphold branding throughout the project. Additionally, I created new components to align with the Smart Trigger Project's requirements.
Refining the Design
The dashboard design underwent several iterations through A/B testing while adhering to a hierarchical design system. I developed various designs, tested them for user engagement, click-through rates, and time spent on the page, and made final adjustments based on these results. Enhancements included adding a search bar, data filters, and layout changes to improve user-friendliness and effectiveness.
02

see also